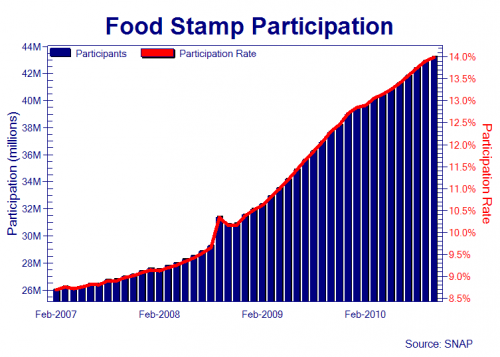
Contrary to the opinion that our economy is on a booming trajectory to the moon, the following chart from the USDA Food and Nutrition Service tells the real story:

One in seven Americans now depend on food stamps to pay the grocery bill each week, and according to a recent report, private food distribution and food assistance organizations have seen a 10% rise in their client base. This on top of reports that food banks are actually running low on food (1,2) due to fewer donations caused by a failing economy and rising food prices.
Had someone forecast in 2007 that the rate of food stamp participation would nearly double by 2011 few would have believed it, likely dismissing the thought as lunacy. But the chart above shows that the prediction would not have been too far off. And given that the employment situation remains bleak, while commodity prices around the world continue to rise, we would not be at all surprised to see the participation rate accelerate and reach 50 million within the next 18 months.
If we see the kind of 50% zhang in prices that is currently being experienced in China, it may come even sooner. Looking strictly at the government’s CPI inflation data, one might surmise that prices have “stabilized” with an inflation rate of just under 2%. The problem, of course, is that this data does not account for food and energy prices because they are considered too volatile.
In April of 2010 we wrote the food price trend at that time indicated that within a year we could very well see an overall increase of at least 26% in grocery stores price. By October of 2010, we were able to see this trend almost fully develop, as commodity prices the world over shot up significantly, with the cost of wheat, oats and sugar up 74%, 68%, and 44% respectively. (See the year over year commodity price chart here)
We say almost fully developed, because the prices have not yet hit grocery store shelves – but they will. As Karl Denninger has pointed out recently, what we’re seeing right now is margin compression. Campbell’s soup, for example, utilizes a variety of commodities to manufacture their products, yet we have not seen a 50% – 100% increase in the price of a can of soup – not yet at least. Campbell’s has been taking a hit to their profit margin as retail prices have been kept relatively stable while their production costs are increasing.
Companies like Campbell’s that sell commodity based products and services simply cannot operate in this manner for much longer. At some point they will have to raise prices. It’s as simple as that. According to a November 2010 report from The Street, companies are willing to take those margin compressions for a while, but they’ll only be able to wait three to six months before passing those costs on to consumers. That six month window is almost up.
And, that means in 2011 more people will find it difficult to put food on the table. Many will have to cut back on, or eliminate, discretionary spending altogether, causing further malaise to the economy, as this will lead to even more lost jobs and subsequently more people requiring the assistance of already strained state and federal budgets for subsidies. The cycle will continue for years to come. And we will continue to see the SNAP food stamp participation rate make record gains.
The trend is clear.
For those with the available means to do so, we recommend following, at least in part, the strategy we outlined for Wealth Preservation, Investing, and Prepping during Hard Times. It’s simple, really, buy commodities at today’s lower prices and consume them at tomorrow’s higher prices. Based on the commodity price movements of 2010, one stands to gain over 30%, and as high as 76%, on most every food and energy product in the world once those costs are passed on to the retail consumer side of things.
In addition to the benefit of investment gains, when you hold your own commodity inventories you don’t have to worry about trading paper stocks or capital gains taxes – and you’re prepared in the event of a major disaster, hyperinflationary disruptions to commerce or other unforeseen events.
References: Zero Hedge, Bearish News


0 Comments